At a glance
- Dates
- –
- Context
- Tools
Overview
Carbon footprint assessment of ENSIM’s emissions, following ADEME criteria.
Problem
Measure the school’s greenhouse gas emissions over 2023, to know where to act and to raise awareness among students and staff.
Role
Project lead, team of 3.
Decisions
The GHG Protocol method in three scopes, recommended by ADEME; a survey of students and staff, completed by interviews with the school’s departments; an uncertainty estimated for every item.
Result
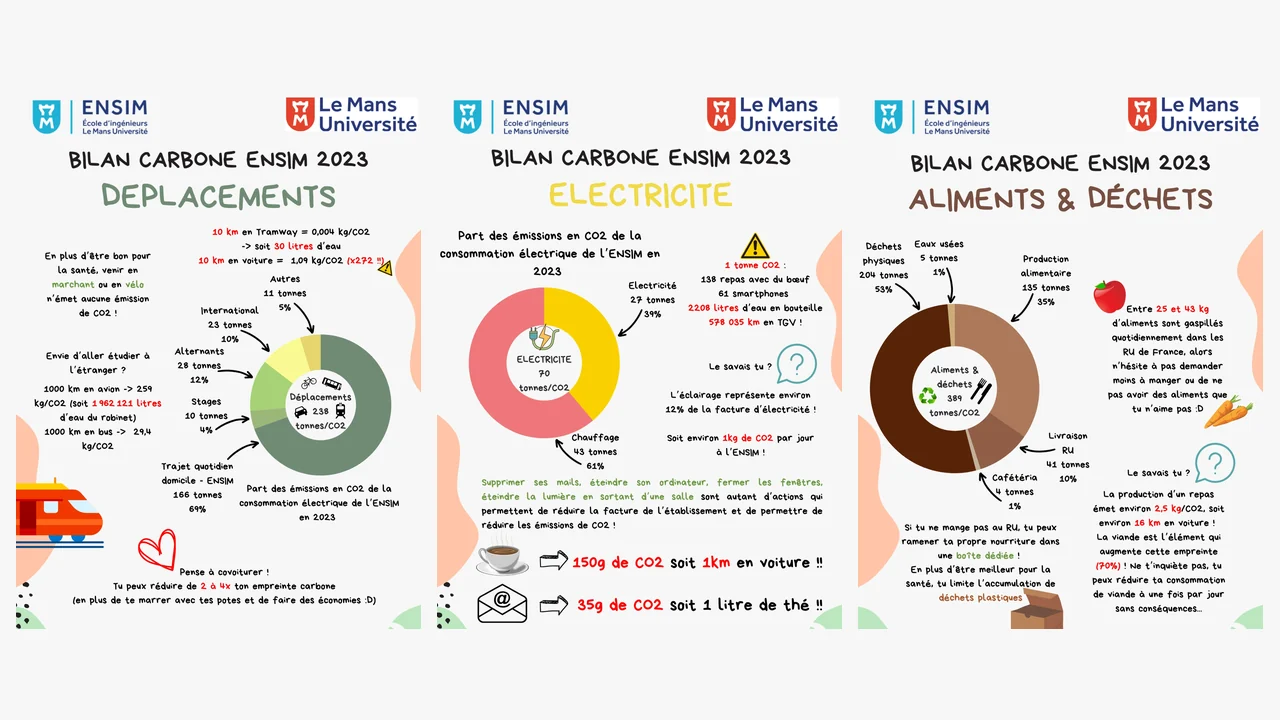
A full report: emission items ranked, a comparison with other schools and ways to reduce them, together with awareness posters.
Team organisation
A compulsory third-year project, carried out by a team of three.
Scope, task list and schedule were set at the start; the work was then shared out, each of us able to help on the others’ tasks. Every document stayed available to the whole team, and the interviews were conducted by the three of us.
Specification
| Item | Content |
|---|---|
| Request | The school’s 2023 carbon footprint, ways to reduce it and an awareness campaign. |
| Deliverables | A full report to the current standards, intended for ADEME; awareness posters. |
| Tools | Carbon footprint spreadsheet, ADEME emission factors, the school’s internal data and suppliers’ data. |
| Team | Three students, one three-hour session a week plus personal work. |
Approach
- Choose the method. Two methods compared; the GHG Protocol was chosen: it splits emissions into three scopes (direct emissions, purchased electricity, other indirect emissions), and it is the method recommended by ADEME.
- Set the scope. Building energy, travel (daily commutes, internships, work-study, semesters abroad, tutors’ visits), catering, waste, purchases and deliveries, events. What is left out is stated.
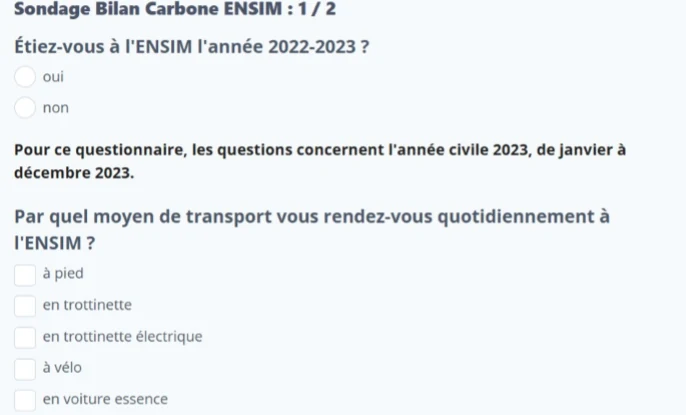
- Collect. An online survey (109 answers for 381 students), data from the school’s departments and interviews with the people in charge.
- Convert. For each item, the activity data multiplied by its emission factor, in spreadsheets.
- Estimate the uncertainty of each item, from 5% to 70% depending on data quality; a 95% confidence level for what is extrapolated from the survey.
- Summarise. Results by scope and by sector, comparison with other schools, ways forward.
Results
- of CO2 emitted in 2023, with an estimated uncertainty of 34%
- 775.7 t
- per student (381 students)
- 2.03 t
- emission items quantified, each with its uncertainty
- ≈ 20
- survey answers, for 381 students
- 109
Half of the emissions come from food and waste, nearly a third from travel. Heating and electricity for the building account for only 9%.
| Scope | What it covers | t CO2 | Share |
|---|---|---|---|
| 1 — Direct emissions | Gas heating, the school’s vehicle | 43 | 6% |
| 2 — Purchased electricity | Building electricity | 27 | 3% |
| 3 — Other indirect emissions | Travel, food, waste, purchases and deliveries, events | 706 | 91% |
Scopes follow the GHG Protocol convention; the report grouped travel with energy.
| The ten largest items | t CO2 |
|---|---|
| Waste from the university restaurant and the school | 204 |
| Students’ and staff’s travel to the school | 166 |
| Meals at the university restaurant | 135 |
| School events | 50 |
| Gas heating | 43 |
| Deliveries to the university restaurant | 41 |
| Work-study students’ travel to their company | 28 |
| Building electricity | 27 |
| Semesters abroad | 23 |
| Supplies and paper | 20 |
Ways forward proposed
- Buildings: insulation, energy monitoring and control.
- Travel: public transport, cycling, car-sharing; train rather than plane when possible.
- Waste and food: waste sorting, compost, local produce.
- Awareness: campaigns and posters.